Manual trading
Order flow and footprint charts: how to read who is buying and who is selling
Two green candles of the same size can tell opposite stories. In one, buyers came in at market and pushed the price up. In the other they bought even more and the price barely moved. A candlestick chart draws both the same way. Order flow does not: it shows who was aggressive, at which price, and whether the price followed.
- Order flow splits volume into market buys and market sells, the orders that move the price.
- A footprint splits each candle by price: every row shows how much was bought and sold at market, the delta (buys minus sells) and the price with the most volume (POC).
- The key reading is the delta against what the price did. If they point the same way, that side is in control; if not, there is a divergence. Absorption goes one step further: the exact price where one side pushed and could not get through.
What order flow is
Every trade has a buyer and a seller, so volume alone does not tell you who pushed. The difference is who was in a hurry. A limit order waits in the book at one price; a market order crosses the book and fills against whatever is there. The side that sends the market order is the aggressive side, and it is the one that moves the price: when market buys eat every limit sell at a price, the price moves to the next one.
Reading order flow means reading that aggressive side: how much was bought and sold at market, and at which prices. The difference between the two is the delta. A positive delta means more was bought at market than sold; a negative one, the opposite.
What a footprint chart is
A footprint draws order flow inside each candle. Instead of a body and two wicks, the candle is split into price rows, and each row shows what was bought and sold at market in that slice of price.
BTC · 15mΔ +$7.3M56% buysBuyers lead
- The usual candle, thin on the left: open, high, low and close.
- One cell per price row: green where market buys beat market sells, red the other way. The stronger the colour, the bigger the difference, and the number is that difference.
- The yellow frame is the POC (point of control): the price where the most traded inside the candle.
- The bottom row is the delta of the whole candle. At the top, the chart legend sums it up with the share of buys and a short reading.
This is where the numbers come from. Each row adds up the market buys and market sells in its $25 slice, and the candle's delta is the sum of every row:
| Price ($) | Market buys | Market sells | Delta |
|---|---|---|---|
| 80,175 – 80,200 | $2.1M | $3.0M | −$0.9M |
| 80,150 – 80,175 | $4.8M | $3.1M | +$1.7M |
| 80,125 – 80,150 | $6.2M | $3.4M | +$2.8M |
| 80,100 – 80,125 (POC) | $7.9M | $4.6M | +$3.3M |
| 80,075 – 80,100 | $5.6M | $4.9M | +$0.7M |
| 80,050 – 80,075 | $4.0M | $3.6M | +$0.4M |
| 80,025 – 80,050 | $2.9M | $3.3M | −$0.4M |
| 80,000 – 80,025 | $1.2M | $1.5M | −$0.3M |
| Whole candle | $34.7M | $27.4M | +$7.3M |
56% of the volume was bought at market ($34.7M of $62.1M), the delta is +$7.3M and the candle closed near its high: buyers were in control. The POC, between $80,100 and $80,125, sits halfway up the move. In the top row more was sold than bought, which is common at the top of a candle: sellers were already coming in there.
How the footprint works on MyLiquidBot
On the Trade chart, the footprint has its own button in the toolbar, next to the order book. Open it and turn on the Footprint switch. It starts off, and your browser remembers how you leave it.
- Where the data comes from. Market buys and sells on the largest centralized exchanges, added together (the chart calls them "CEX"). It is the flow of those exchanges, not of the exchange you trade on. If the market on your chart trades a little above or below them, the footprint is moved onto its candles and the cell's explanation says by how much.
- Coins and timeframes. Candles from 1 minute to 1 day. The most followed coins keep the last 48 hours; the rest fill in from the moment you open the chart. Next to the switch it says which is your case: "Last 48 h + live" or "Live since you opened the chart". A coin that is not listed on the large centralized exchanges has no footprint, and the chart tells you.
- Zoom. Turning it on zooms the chart in so the numbers fit. Zoom out and the cells lose their numbers but keep their colour, and the delta becomes a colour mark under each candle. Far out, the chart asks you to zoom in.
- Colours are relative. The strength of a colour is measured against the most lopsided cell on your screen, so the same cell can look stronger or softer depending on what you show.
- The legend. Next to open, high, low, close and volume you get the delta, the share of buys and a short reading of the candle you point at, or of the newest one when you point at none.
- Every cell explains itself. Hover or tap a cell to see its price slice, what was bought and sold there, the whole candle and its reading. A click or tap keeps it open; your next gesture closes it.
- Incomplete candles. When part of a candle is missing, for example because you just opened the chart on a coin with no history, it is drawn fainter and its delta has a "≈" in front.
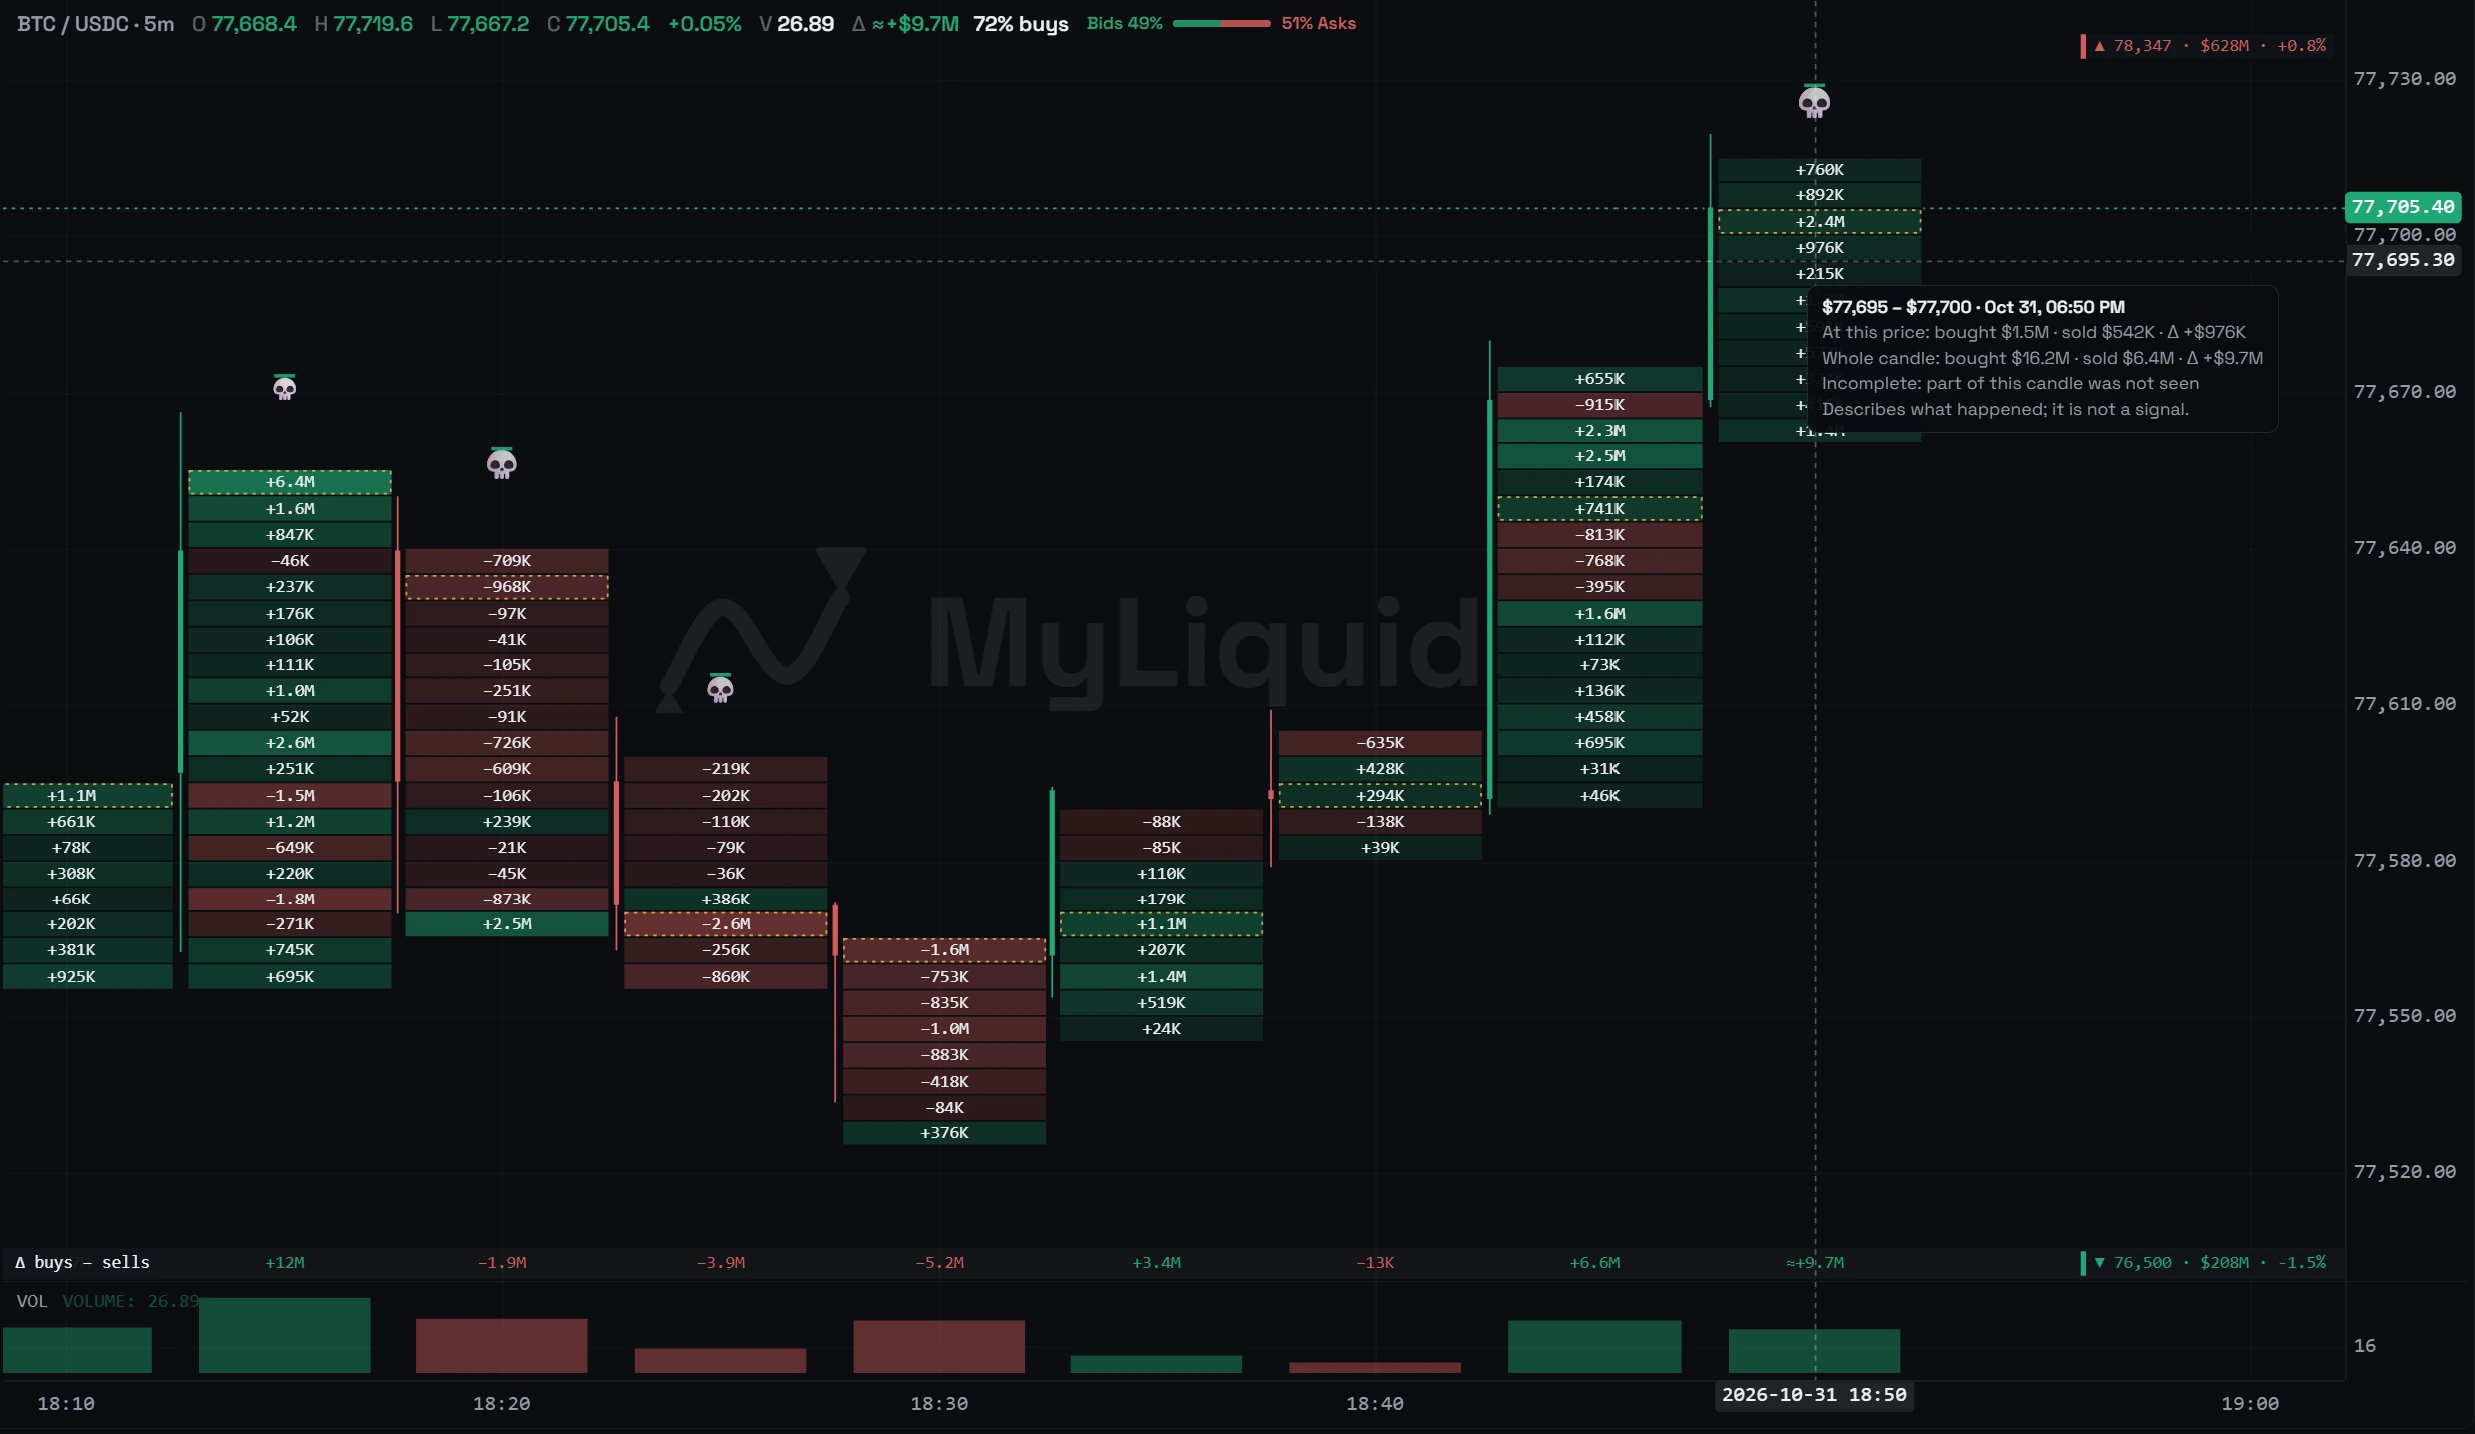
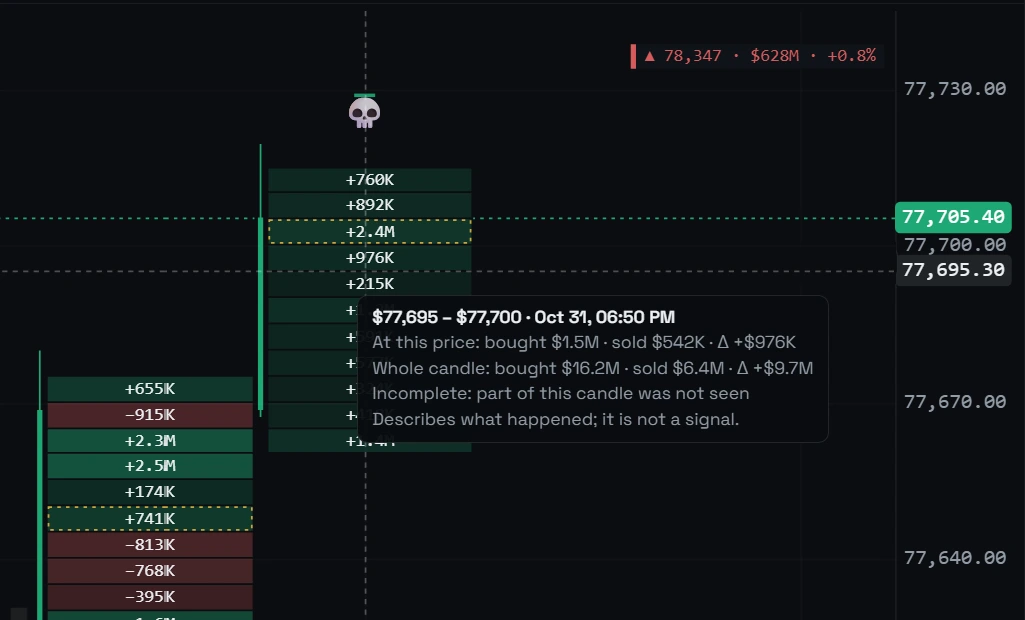
How to read a candle, step by step
- Look at the delta. Who was more aggressive, buyers or sellers, and by how much? Compare it with the candles next to it, not in absolute terms: $5M is a lot on a 1-minute candle and little on a 4-hour one.
- Compare it with the candle's body. Positive delta and a candle that rises: buyers are in control. Positive delta and a candle that does not rise, or barely moves for its range: that is a divergence, they bought more and the price did not follow. The same goes the other way for sellers.
- Look at where the volume is. The POC and the strongest cells show the prices that were fought over. Heavy volume at the end of a wick is volume the price rejected.
- Look for absorption frames at the edges. They mark the exact price where the aggressive side was stopped.
The legend sums up each candle with one of these readings:
Buyers lead
They bought more and the price rose.
Buying, price not rising
Divergence: they bought more and the price did not rise; sellers may have been waiting with limit orders. Here the high also has an absorption frame.
Selling, price not falling
Divergence: they sold more and the price did not fall; buyers may have been waiting with limit orders. Here the low also has an absorption frame.
Buys ≈ sells
Buying and selling were close: nobody led.
More market buyingMore market sellingPrice with the most volume (POC)Absorption: the frame takes the colour of the side that held
A divergence says one side pushed and the price did not follow, but not why: there may have been limit orders on the other side, orders may have been pulled, or a few large orders may have made the delta. That is why the chart only names it in the legend and in the candle's explanation.
Absorption is more specific, and it is marked at the price where it happened. On MyLiquidBot, a frame at the edge of the candle with the word "Absorption" shows when the bottom of the candle took mostly market selling, held a large part of its volume, and the candle still closed in its upper half: buyers held, green frame. Or the same at the top, with buying and a close in the lower half: sellers held, red frame. Candles with clearly less volume than the ones before them get no mark, and the mark does not change when you zoom.
What it is for
- See whether a breakout has buying behind it. A candle that breaks a high with positive delta and green cells all the way up has buyers paying to go higher. If it breaks and closes back below with an absorption frame at the top, buyers paid and were not let through.
- See who defends a level. Heavy market selling into a support, with the candle closing away from it, is absorption: buyers with limit orders held it. Where those orders sat before the price arrived is what the Order walls on the same chart show; the footprint tells you whether they held.
- Read a wick. A long wick with the POC inside it is volume that traded and was rejected. A wick with almost no volume is a price that was only touched in passing.
- See whether a move is running out of steam. If the price keeps making highs but each candle arrives with less delta, or negative delta, fewer buyers are willing to pay to go higher.
- Follow an open trade. If you are long and candles start reading "Buying, price not rising" next to a sell wall, there is buying and the price is not moving. That is information for your plan, not an order to close.
A worked example
Illustrative numbers: BTC on 15-minute candles. Below the price there is a band of long liquidations between $79,650 and $79,720 (the kind you would see on the liquidation heatmap) and above it a sell wall at $80,350 (the kind you would see in Order walls).
- The price falls into the liquidation band with "Sellers lead". The third candle reads "Selling, price not falling": market selling goes on (negative delta) and the candle closes higher. A green absorption frame also shows at the bottom: the selling piled up at the low and could not break it.
- The next two candles read "Buyers lead": positive delta and the price rises.
- Under the wall, the candle buys hard at the top and still closes red: "Buying, price not rising", with the red absorption frame at its very top. The buying piled up at the high, right under the wall, and the candle closed in its lower part.
Long liquidations (heatmap)Sell wall (Order walls)
None of this says where the price goes next. It says what happened at each price, and that changes how you read the chart. The low of the third candle is not just a wick: it is a price where market selling piled up and could not get through. The high of the sixth is not just any failed breakout: buyers paid to go higher and could not. If you place an entry or a stop near those prices, you know what was there.
What a footprint does not tell you
- It only sees market orders that filled. Limit orders waiting in the book do not show; that is what Order walls and the Book profile are for.
- It is not your exchange's flow. It is the flow of the largest centralized exchanges, added together. Prices move almost in step, but each exchange's volume is different.
- A divergence does not say why. Buying more without the price rising can come from limit orders, pulled orders or a few large orders.
- One candle is a snapshot, not a trend. An absorption can give way on the next candle.
- It describes, it does not predict. The chart says so itself at the end of every explanation: it describes what happened; it is not a signal.
How to turn it on in MyLiquidBot
- Create an account on myliquidbot.com.
- Connect a supported exchange in Account → Exchanges.
- Open Trade, open the chart, press the Footprint button in the toolbar and turn on the switch.
- Pick candles of 1 day or less and zoom in if you do not see the numbers.
It is free: no subscription or plan needed.
Frequently asked questions
What is order flow in trading?
Reading how much was bought and sold with market orders, and at which prices. Market orders are the ones that move the price, so order flow shows who pushed and where.
What is a footprint chart?
A chart that splits each candle into price rows and shows, for each row, the market buys and market sells, their difference (the delta) and the price with the most volume (the POC).
What is delta?
Market buys minus market sells. If it is positive, more was bought than sold. Always read it together with what the price did.
What is absorption?
Heavy market selling at the low of a candle, or buying at the high, that fails to carry the price: the candle closes away from that end. It usually points to large limit orders on the other side.
What is the difference between divergence and absorption?
A divergence is a candle whose delta goes against its own move: they bought more and it did not rise, or sold more and it did not fall. Absorption is more specific: it marks the price, at the low or the high, where that push piled up and could not get through. A divergence does not always come with absorption.
What is the POC?
The point of control: the price with the most volume traded inside the candle.
Does the footprint show the trades of the exchange I trade on?
No. It adds up the market trades of the largest centralized exchanges. If your market trades a little above or below them, the footprint is moved onto your candles so each cell sits at its price.
Is the MyLiquidBot footprint free?
Yes. It needs an account and a connected exchange, with no subscription or plan.