Manual trading
Liquidity sweep: what it is and how to identify one in crypto
A liquidity sweep is a fast move through a price where many stop orders and liquidations are waiting: it sets them off and then turns back. Those forced orders are the size that large traders need to fill their own, which is why a sweep so often marks the end of a move rather than its start.
- Liquidity sits just beyond obvious highs and lows: stop orders, breakout orders and, in crypto, the liquidation prices of leveraged positions.
- A sweep trades through that level, sets those orders off and closes back on the other side. A breakout closes beyond it and holds.
- In crypto you don't have to guess where the liquidity is: liquidation maps show it, and executed liquidations show when it fired.
What a liquidity sweep means
In trading, liquidity is the orders waiting in the market. Most of them can't be seen on a chart, but traders put them in predictable places. A long's stop loss goes just under a recent low, a short's stop goes just above a recent high, and breakout traders put buy stops above highs and sell stops below lows.
A liquidity sweep is price going to those orders. When it trades through a low, every sell stop under it turns into a market sell. Someone who wants to buy a large size can buy from all of those sellers at once, without pushing the price up against themselves. Once the orders are used up, nothing is left to push price further, and it often snaps back. It works the other way too: a large holder closing a long sells into a sweep of the highs, and the traders it sells to become its exit liquidity.
You will also hear stop hunt, stop run and liquidity grab. They describe the same mechanism. Some traders keep "grab" for a single quick wick and "sweep" for a deeper run that clears a whole area, but you read and trade them the same way.
Where the liquidity sits
Above the price is buy-side liquidity: the stops of short sellers, the buy stops of breakout traders and, in crypto, the liquidation prices of shorts. Below the price is sell-side liquidity: the stops of longs, the sell stops of breakout traders and the liquidation prices of longs.
| Where | Why orders gather there |
|---|---|
| Equal highs or equal lows | Two or three touches of the same price look like strong support or resistance, so stops pile up just beyond it. |
| Previous day's or week's high and low | Levels every trader can see on any chart. |
| Edges of a range | Breakout orders and stops sit on both sides of it. |
| Round numbers | Prices like $100,000 on BTC are where people put entries, stops and targets. |
| Liquidation clusters | Leveraged positions opened in the same area share a liquidation price, and each one is a forced market order. |
Why sweeps are easier to read in crypto
In stocks and forex, stop orders are invisible: you infer them from the chart. Crypto perpetual futures add a second kind of liquidity that is much easier to locate. Every leveraged position has a liquidation price, and when price reaches it the exchange closes the position with a market order. A liquidated long sells; a liquidated short buys.
On Hyperliquid and Lighter, positions are public, so their liquidation prices are real data, not guesses. On centralized exchanges they can be estimated from open interest. Put both on a map and the liquidity under equal lows stops being a theory: you see how much money would be forced out, and where.
Liquidations also leave a trace. When a sweep goes through a cluster, the liquidations are executed and recorded, so you can check whether the fuel really fired or price only came close. The free BTC and ETH liquidation maps show the real Hyperliquid and Lighter positions without an account, and How to read a liquidation heatmap explains how to read them.
What a liquidity sweep looks like
- Two equal lows. Sell stops and the liquidation prices of longs gather just under them.
- The liquidation band: leveraged longs that would be forced to sell here.
- The sweep. One candle trades through the lows and the band: stops and liquidations fire as market sells (the skull), and the band fades because that money is gone.
- The same candle closes back above the lows. The sellers have run out, and price moves away from the level.
The shape repeats on every timeframe:
- A long wick through an obvious level, with the body closing back inside the range.
- A burst of volume and executed liquidations on that candle, usually more than on the candles around it.
- A quick move away from the level. The longer price stays beyond it, the less likely it was a sweep.
Liquidity sweep or breakout?
Both start the same way: price runs through a level and sets off the orders behind it. The difference is what price does next.
Sweep
Wick above the highs, close back under them, no trade above them again.
Breakout
Close above the highs, the retest holds, price keeps going.
| Liquidity sweep | Breakout | |
|---|---|---|
| Close | Back inside the range | Beyond the level |
| Next candles | Move away from the level | Retest the level and hold it |
| Order flow on the run | Heavy market orders that don't move price any further | Market orders that keep moving price |
| Next liquidation cluster | Far away: no fuel left in that direction | Close by: more fuel in the same direction |
If you can't tell yet, wait for the close. A wick is only a sweep once the candle has closed back inside.
How to identify a liquidity sweep, step by step
- Mark the pools. Equal highs and lows, the previous day's high and low, range edges, round numbers. Then check the liquidation map: a level with a liquidation cluster just beyond it holds the most fuel.
- Wait for price to trade through. Price stopping at the level is not a sweep. You want it beyond, where the stops and liquidations are.
- Check that the fuel fired. Executed liquidations on that candle and a liquidation band that fades show that the forced orders really went through.
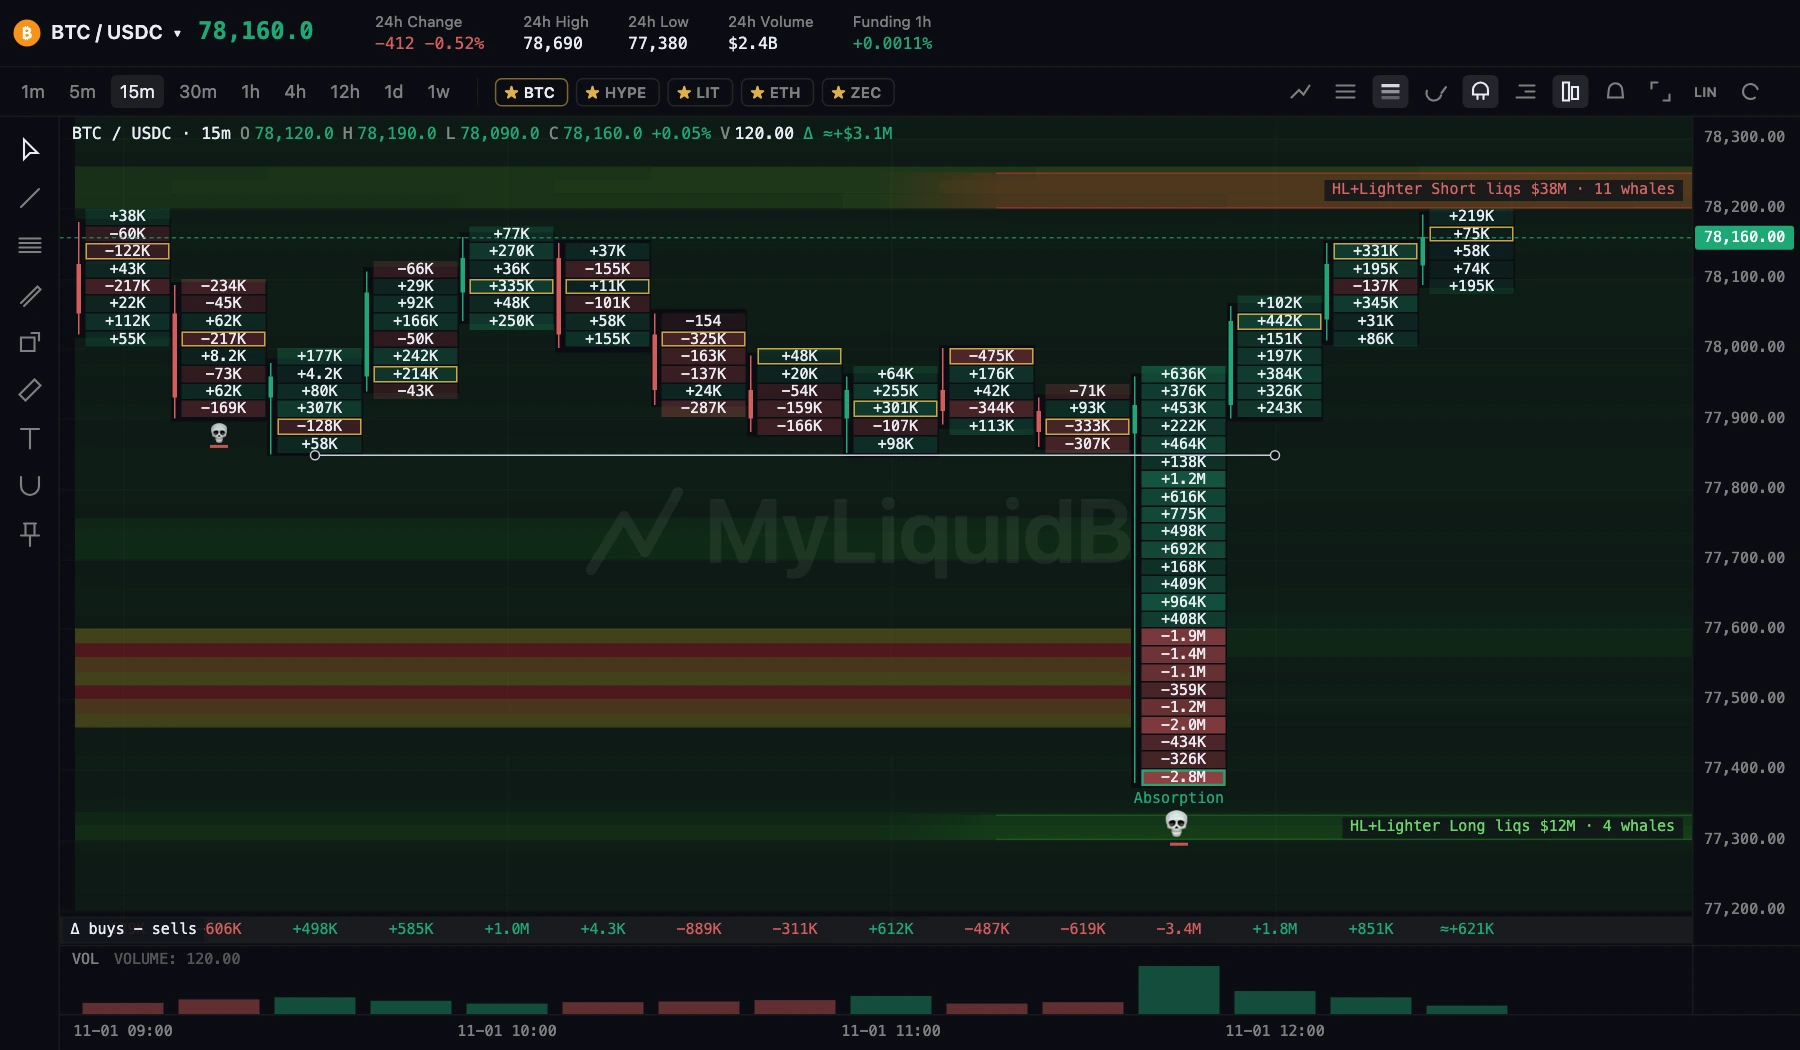
- Read the order flow at the extreme. On a footprint chart, heavy market selling at the low with the candle closing away from it is marked as absorption: limit buyers took everything that was sold. If the candle's delta is negative but it closed up, the legend reads "Selling, price not falling".
- Wait for the close back inside. The candle closes back above the low that was swept, or below the high. On a lower timeframe, the first higher high after a swept low is extra confirmation.
- Know what cancels it. If price closes beyond the level and holds the retest, it was a breakout. Stand aside or trade it as one.
Seeing sweeps on the MyLiquidBot chart
Each step has a tool on the Trade chart toolbar:
| Tool | What it shows in a sweep |
|---|---|
| Liquidation heatmap | Where the liquidation clusters sit before price gets there, and the band fading once price trades through it. |
| Liquidations | A skull on each candle where liquidations were actually executed: proof that the fuel fired. |
| Order book | Walls of resting limit orders. A large buy wall under the lows is someone waiting to absorb the sweep. |
| Footprint | Market buying and selling at each price inside the candle, with absorption marked at the high or the low. |
| Whales | The largest public positions and Smart Money entries: who opened a long right at the swept low. |
They are all free: sign in, connect an exchange in Account → Exchanges and turn them on from the chart toolbar. No plan or subscription.
A worked example
Illustrative numbers. BTC has bounced twice from $77,850. The on-chain map shows a red band of long liquidations at $77,450–77,600, just under those lows, and a yellow band of short liquidations at $79,350–79,500 above.
- Equal lows at $77,850, with long liquidations stacked under them.
- A candle wicks to $77,380: skulls print, the band fades and the footprint marks absorption at the low. It closes at $77,920, back above the lows.
- Long at $77,950 on the next candle. Stop at $77,250, under the wick, where the idea is proven wrong.
- Take profit at $79,250, in front of the short liquidations, not inside them.
Long liquidationsShort liquidations
Two details matter more than the entry. The stop goes beyond the wick, not just under the old lows: the lows were the liquidity, and anything near them gets taken by the next sweep. And the take profit sits in front of the next cluster, because that is where the next sweep is likely to happen, and price can turn just before reaching it.
Common mistakes
- Buying the first touch. Price reaching equal lows is the setup, not the signal. Without the run through and the close back above, you are buying right before the stops fire.
- Putting your stop just beyond the obvious level. That is where the liquidity is. If your stop sits there, you are the fuel. Place it beyond the cluster and size the trade so the wider stop fits.
- Calling every wick a sweep. A wick through a minor level on a 1-minute chart is noise. Sweeps of levels that many traders watch, on 15 minutes or higher, carry more weight.
- Trading against a strong trend. In a strong downtrend, a sweep of a high that turns price down again is more reliable than a sweep of a low.
- Using too much leverage. If your own liquidation price sits inside the cluster, the sweep you are waiting for closes your position first. Check it with the liquidation price calculator before you enter.
Frequently asked questions
What is a liquidity sweep?
A quick move through a level where stop orders and liquidations are waiting, which sets them off and then reverses. The forced orders give large traders the size they need to fill their own.
What does a liquidity sweep look like?
A long wick through an obvious high or low, with the candle closing back inside the range, usually with a burst of volume and executed liquidations, followed by a move away from the level.
Is a liquidity sweep the same as a stop hunt or a liquidity grab?
They describe the same mechanism. Some traders call a single quick wick a grab and a deeper run that clears a whole area a sweep.
How do I know it is a sweep and not a breakout?
Wait for the close. A sweep closes back inside the range and moves away from the level; a breakout closes beyond the level and holds the retest.
Which timeframe works best?
Sweeps of levels that many traders watch matter most: daily and 4-hour highs and lows, and ranges on 15-minute or 1-hour charts. On the lowest timeframes most wicks are noise.
Can I see liquidity sweeps on MyLiquidBot for free?
Yes. The BTC and ETH liquidation maps are public. The full chart, with every coin, executed liquidations, the order book and the footprint, needs an account and a connected exchange, with no plan or subscription.